
Your Complete Google Analytics Introduction to Social Media Reporting
As an online business owner, the importance of social media for gathering leads, finding blog fans, and generally increasing our reach can’t be understated.
Many of our favourite social networks provide their own analytics to varying degrees … provided we have created a business profile/account. The only problem is that we can’t see how each of them compares to each other without doing a lot of manual reporting and number crunching.
Though I do have a math degree, I still don’t want to spend all my time consolidating numbers across a bunch of reports.
That’s where Google Analytics can step in and help us. They have an entire section dedicated to providing info about how your social media presence is affecting your website.
How great is that?!?
So let’s get into this Google Analytics Introduction to Social Media Reporting …
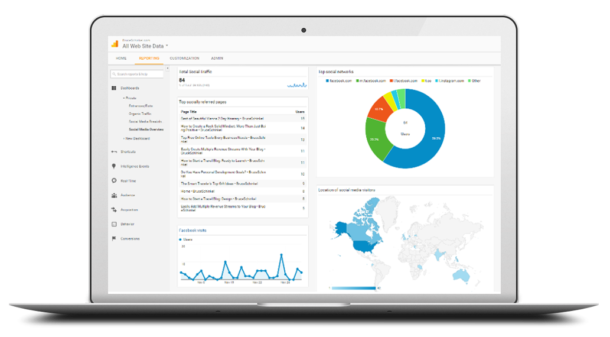
Social Media Dashboard Reports
If you haven’t yet picked up my FREE Google Analytics Dashboard Templates, make sure you get them now. There are 2 dashboards included that will immediately help make you make sense of your social media traffic.

Understanding Social Media Reports
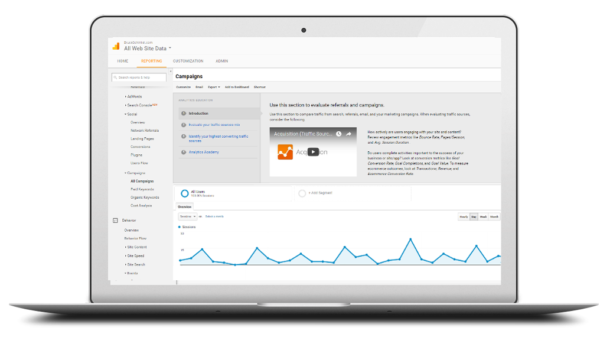
Google Analytics provides 6 different social media reports that are set up for you. They are accessed on the Reporting screen, under Acquisition -> Social:
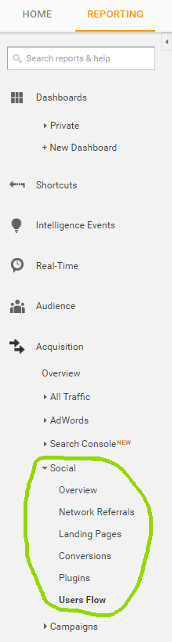
- Overview – This report uses goal setting (more on that in another post) to determine how well your website is converting visitors into taking the actions your most concerned with (buying products, filling out opt-ins, etc). It compares your total conversion rate to that the results from social media referrals.
- Network Referrals – This report shows you which social networks are providing the highest quality traffic. You can compare total referrals to conversions to figure out which social networks you should focus more/less energy on. For example, if Pinterest is providing a low number for referrals, but those who are coming across are very actively engaged on your site, you may want to consider attracting more Pinterest referrals.
- Landing Pages – This report shows you which pages from your site are being shared the most on social media. You can add segments that will further break this report down by social network if desired.
- Conversions – As with the Overview report, this report also uses goal setting. It helps quantify the value of your social networks by attaching a value to the conversions they initiate.
- Plugins – This report can provide details about on-site engagement with visitors who share your content on Social Networks.
- Users Flow – This report provides a graphic flow diagram of traffic volumes and visitor traffic patterns. You can quickly see where visitors are coming from, where they enter your site, and where else the navigate before leaving. I find this to be the most helpful of the Social Media Reports.
Ready to get more out of your Google Analytics Social Media Reporting?
Click the button below and get my FREE Dashboard Templates sent directly to your inbox, including 2 awesome reports specifically designed to help you read the social media habits of your visitors.
It’s as simple as assigning the templates to your website in Google Analytics and you’ll be off to the races!
Why struggle with starting from scratch when the work is already done for you?
Was this helpful for you? If so, please comment below and share this Google Analytics Introduction with your blogging friends to hep them get the most out of their Social Media Reporting.
Was this helpful for you? If so, please share it with a friend who you think would get value!
Be sure to comment below and let me know how this Google Analytics Introduction helped your Social Media Reporting!
P.S. If you’d LOVE to start Your Own Blog with “Just 3 Clicks”, check THIS out!
Was this valuable for you? If so I’d really appreciate your comments below and shares on social media.
Resources
Here is a list of the resources mentioned in this post:
Dashboard Templates – Download my FREE Dashboard Templates to give your Google Analytics Reporting a head start!
Blogger’s Jumpstart Guide – Download my FREE guide outlining how to successfully start your own blog


Bruce thank you for the detailed explanation regarding Google analytics. There is so much data to sift through that many times it can be overwhelming. Thank you for simplifying at hand pointing out a very useful aspect of the reports.
You’re very welcome George, glad I could simplify this area for you!
Great post, Bruce. Google analytics is super. Now I can better understand how other features work which I didn’t even know before, Thank you for sharing.
Hey Sherri, so glad I could help you out with this!
Google analytics can be very confusing. Like the way you break it down step by step. Great post Bruce. Thanks for sharing!
You’re so right Demetri, it’s a bit of a monster!
This couldn’t have come at a better time! Was just looking for info on good Analytics!
Thank you!
Dr. Lisa
So glad to hear that … more analytics details coming soon!
Great info and I will be using it! Sometimes, it can be easy to become overwhelmed at the very mention of the word “analytics”! Great way to break it down so it makes sense. Thanks!
You’re so right about that word, Chondra. Happy this helped you out
Thank you Bruce … it is funny as I was just starting to look into google analytics and your post came at the right time. Very helpful post, cheers.
Happy to hear that Mike! More google analytics posts coming soon