Your Complete Google Analytics Introduction to Dashboard Reporting
Are you overwhelmed and confused whenever you login to your Google Analytics account?
You know there’s a lot of info there, but unsure how to figure it out?
Worry no longer!
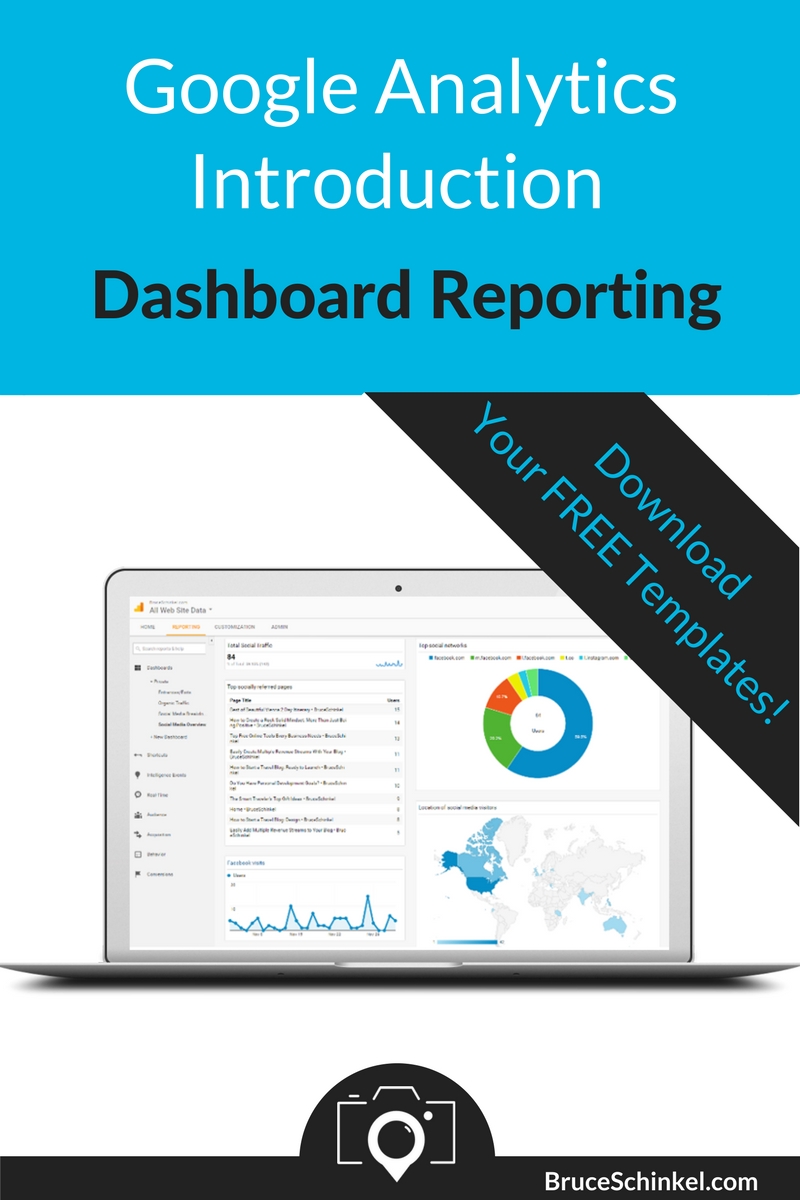
In today’s Google Analytics Introduction I’m going to help you tap into the power of Dashboard Reporting. You can even download some awesome dashboard templates HERE to get you started quickly!
By the end of this post you’ll be able to start asking Google for the information you need to help make those important decisions about where to focus your time and energy to get the most out of your blog.
Ready to get started?
Let’s go …
What is a Google Analytics Dashboard?
A Google Analytics Dashboard is similar to the dashboard you have when you login to your blog in WordPress or most other platforms.
It’s a collection of widgets that provide you with information about your website. Each widget is completely customizable to make sure you’re getting the information that’s most important to YOU.
What does that mean?
Well, say you’ve got an e-commerce section of your website. Wouldn’t it be nice to know where most of your sales are coming from, or which ad campaigns are converting the best?
Maybe you’d just like to know the site usage patterns of your visitors. Do they differ by device? By region of the world?
All this and much more are possible just by looking at one of your dashboards.
Dashboard Basics
Let’s start by breaking down some of the basic terminology you’ll see when customizing your dashboards:
1. Sessions – A session is a group of activities that take place on your website within a given time frame. It could be made up of multiple page views, interactions, and events. If I went to your website and check out all the pages listed in your menu without closing the tab, that is considered one session.
2. Users – A user is a unique person who comes to visit your site. A single user can have multiple sessions. If I was to visit your site once in the morning and then again in the evening, then I am a single user with two sessions that day.
3. Pageviews – A pageview is counted any time a webpage is loaded in a browser.
4. Bounce Rate – The bounce rate is the percentage of single page views on your site, which indicates the number of users who visit only 1 page during a session. High bounce rates might indicate that you have some work to be done either with your content, or overall user experience.
Types of Dashboard Widgets
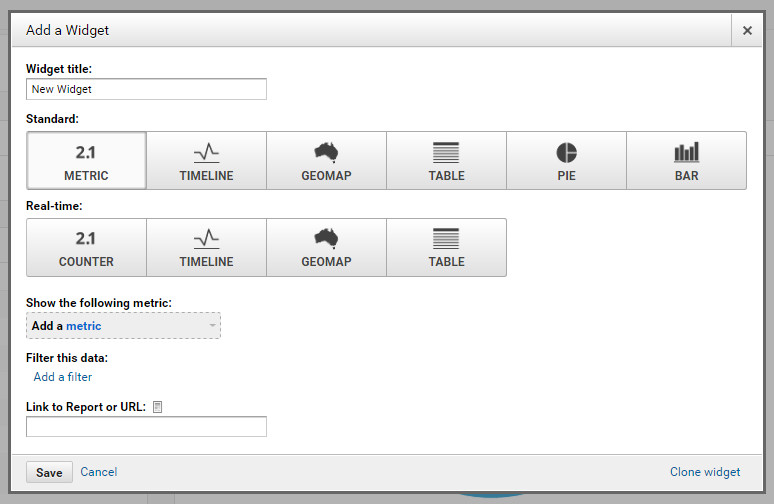
Before creating a new Dashboard in Google Analytics, it’s important to understand what the 6 types of widgets are that are available to you:
1. Metric – Mertic widgets will provide calculation information such as counts and averages.
2. Timeline – Timeline widgets show the trend of a piece of data over time with a line graph.
3. GeoMap – GeoMaps display information organized by continent, country or even city.
4. Table – Table widgets provide a set of information organized by multiple data sets.
5. Pie – Pie widgets provide data results in the form of pie charts.
6. Bar – Bar widgets provide data results in the form of bar graphs.
Example Dashboard: Social Media
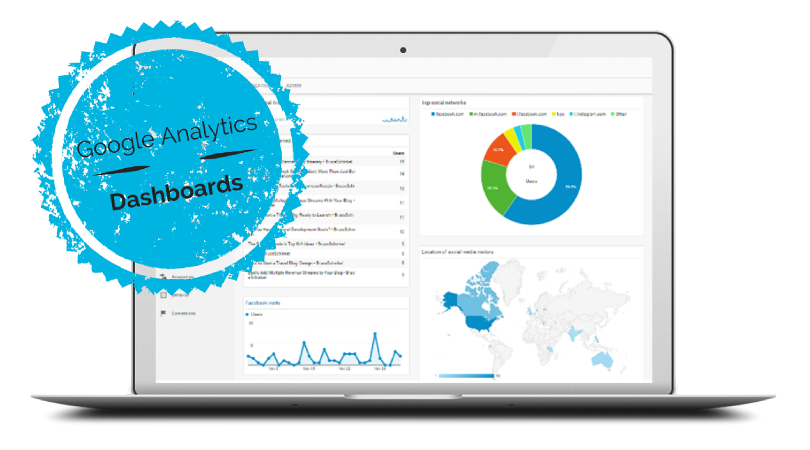
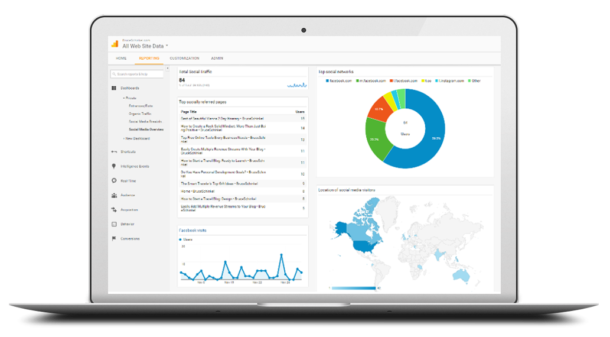
Here is an example of a Google Analytics Dashboard. For this example, I created a Social Media Overview dashboard so I can see where my users are coming from and how my social media activities are contributing to my blog traffic.
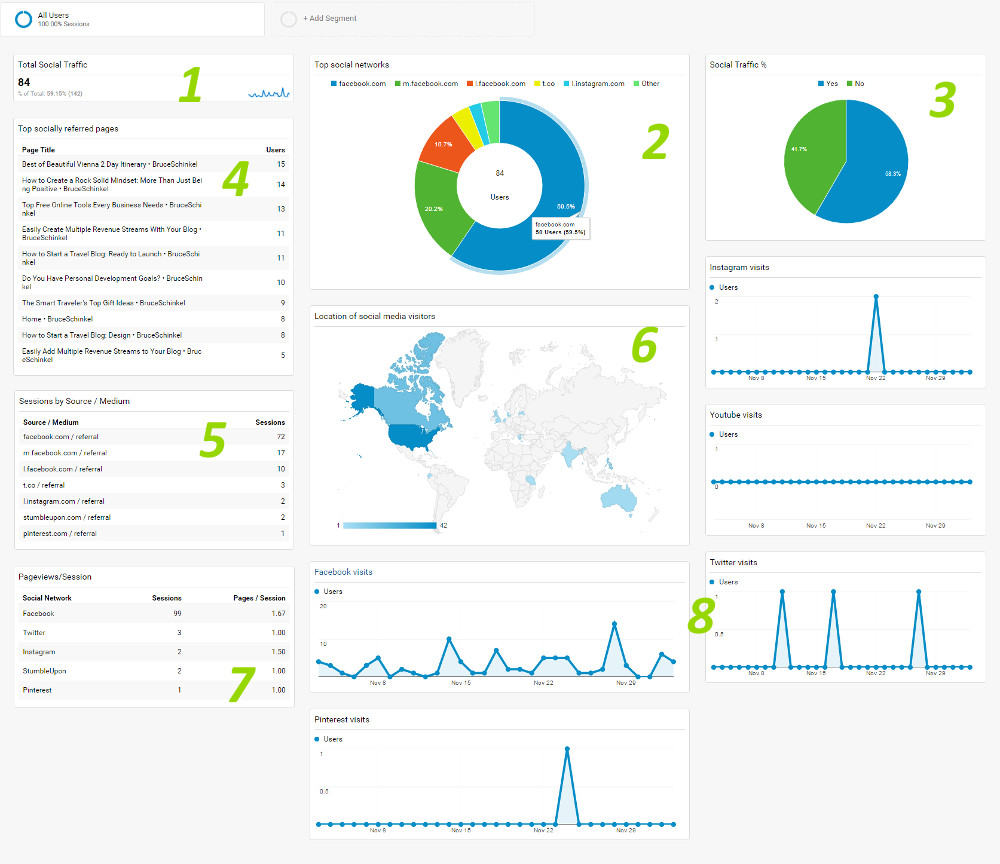
1. The total number (and overall percentage) of visitors who visit my site from social networks.
2. A pie chart that describes which social networks are providing the most traffic to my site.
3. A pie chart that describes the percentage of overall site visits split by social network and non-social sources.
4. A list of my top socially referred pages. Knowing which pages are most popular with users helps indicate the types of posts they’re looking for, and which posts should be optimized for calls-to-action.
5. A list of my top socially referred website sessions. Knowing which social networks are most popular with users helps indicate where I should spend my time promoting.
6. A world map of where my visitors are located. Knowing time zones for high traffic user areas helps define optimal posting and interaction times.
7. A list of my top page views per session organized by social network and total sessions. This describes where my traffic is coming from and how long those users are remaining on the site.
8. A group of line graphs (1 for each social network) showing daily traffic sources. As you can see, I clearly started with Facebook, and have recently been testing Twitter, Instagram and Pinterest. You can easily add and modify to suit your social network requirements.
Creating a New Dashboard
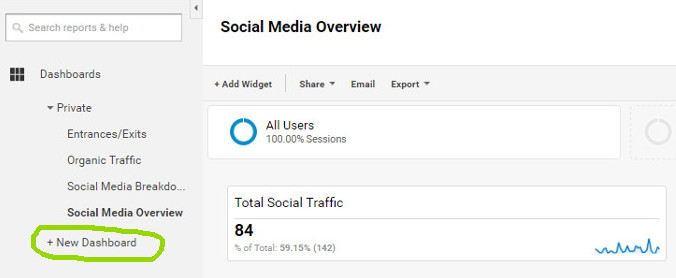
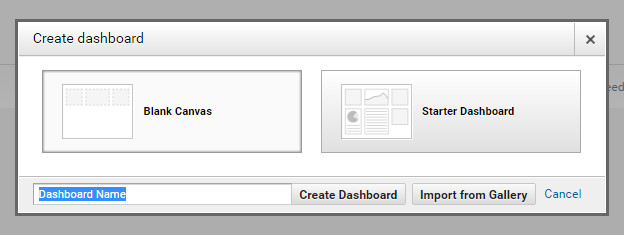
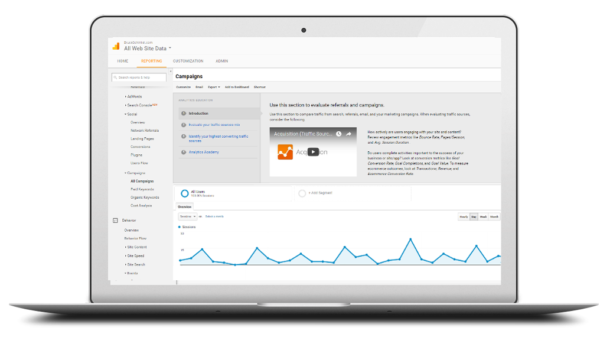
Creating a new dashboard in Google Analytics is as easy as 1, 2, 3 …
Ready to fast-track your Google Analytics Dashboard Reporting?
Click the button below and get my FREE Dashboard Templates sent directly to your inbox.
It’s as simple as assigning the templates to your website in Google Analytics and you’ll be off to the races!
Why struggle with starting from scratch when the work is already done for you?
Was this helpful for you? If so, please comment below and share this Google Analytics Introduction with your blogging friends to hep them get the most out of their Dashboard Reports.
Was this helpful for you? If so, please share it with a friend who you think would get value!
Be sure to comment below and let me know how this Google Analytics Introduction to Dashboard Reporting has helped!
P.S. If you’d LOVE to start Your Own Blog with “Just 3 Clicks”, check THIS out!
Was this valuable for you? If so I’d really appreciate your comments below and shares on social media.
Resources
Here is a list of the resources from this post:
Dashboard Templates – Download my FREE Dashboard Templates to give your Google Analytics Reporting a head start!
Blogger’s Jumpstart Guide – Download my FREE guide outlining how to successfully start your own blog





BRUCE! You explained this techie stuff so well! It is really nice to have this info broken down the way you did!
I am saving this article in my awesome tools folder so I can keep referencing it!
PS… Your site is looking REALLY slick brother!
Thanks so much for dropping by Erin, glad you took away some value!
I thought this was a very informative post. I have always been curious about Google Analytics. This helped me to understand them. I will be downloading your templates too. Thank you for posting this article.
Happy to have helped demystify this for you a bit Roy … i’ll have more posts like this one coming soon!
Wow, Bruce…that was imense! You gave an insightful, informative post that really explains a lot of the techno stuff. Thanks for your hard work on this!
You’re very welcome Theresa, glad you enjoyed the post!
Awesome! You’ve got the complete details about Google analytics. I’ve learned additional info by just reading your post. Thank you so much, Bruce.
So glad you got some value here Sherri!
This is a cool little tool. Thanks for breaking Google analytics into bite size chunks so that I can understand it! Great post Bruce!
You’re very welcome Demetri, making it understandable is the key to making it usable.
Excellent Tutorial on Google Analytics! Bookmarking this for sure 🙂
Thanks so much Dr Lisa!!
Wow Bruce! that is fantastic explanation for Google analytics! I think that guys from Google can learn something here! Excellent post! Thank you for sharing this!
Thanks Hrvoje, so kind of you! Glad to have helped
You did a great job at explaining this technical things! The way you broke down this information is pretty good.
This article is being saved in my excellent tools folder so I can keep using it!
Thanks so much Tigoy! I’m glad I was able to provide some insights for you